This week I have been asked twice about setting up a lab for those who are new to security, or colleagues who are less familiar with detection/response. So I figured that I would setup a quick, and somewhat "dirty" virtual machine for demonstrating at least some basics to seeing how Network Security Monitoring (NSM) looks to an analyst who sees these types of events. As a quick note, I don't do a deep dive in this segment on how to strip out executable from PCAP or perform analysis of the executable, this is more of a demonstration of how you could setup a VM to replay malware PCAPs and see what alerts fire. The following assumes a little bit of knowledge with virtual machines and setting up an OS.
OK, to begin, I downloaded the most recent version of Security Onion. Taking that ISO, and using VMWare, I setup a new Linux Virtual Machine (Ubuntu based 64bit).
After Reboot,You should see the desktop look a little different, run setup again. This is where you will setup your username/password for the various tools included with Security Onion.
sudo tcpreplay --intf1=ens33 <pcap file>


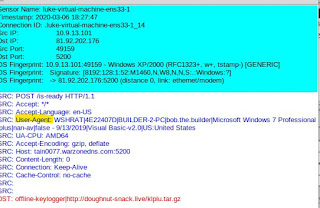
Notice the one highlighted rule looks for the "is-ready" which we see when we pivot to the pcap transcript. Note, this can also be pulled up in Wireshark as well.
One item to note about this VBS Worm family (H-Worm, VJ-Worm etc...) is the information being sent in the User-Agent about the infected host, as highlighted above.
You can learn more about H-Worm in one of my older posts here.
OK, to begin, I downloaded the most recent version of Security Onion. Taking that ISO, and using VMWare, I setup a new Linux Virtual Machine (Ubuntu based 64bit).
Once the OS is loaded to the desktop, simply select to Install Security Onion. I went with a lot of defaults here, I did select to Download updates while installing and id select to "erase disk and install security onion"
One Security Onion is installed and rebooted, select "Setup" from the desktop.
Select "Yes to All"
I used Evaluation Mode, since this is a standalone VM. And for the Network config, I used DHCP (Static is recommended , but since this is more for a quick guide, I just kept it easy).
After Reboot,You should see the desktop look a little different, run setup again. This is where you will setup your username/password for the various tools included with Security Onion.
Once setup, you can then click to launch sguil from the desktop. entering in the credentials you just created. Once logged in, select all sensors and then start sguil. Initially you will have some alerts in the console, you can clear those right away by pressing F8. I will attempt to explain a bit of the sguil console as we intentionally trigger some alerts.
For the fun part! Downloading some malware packet captures and replaying them! For this part I use https://www.malware-traffic-analysis.net/
I grabbed a few random pcaps from the site, this site does an excellent job demonstrating the analysis part of the alerts. I'm just going to demonstrate how to replay these alerts for you to play with.
Just so we have at least 1 common sample to work with, I first downloaded the following PCAP.
The zip file is password protected.
password is "infected"
Before we begin, go ahead and double check your interface name, mine was ens33 here.
OK, so, we should have a cleared Sguil Console, we should have unzipped our PCAP, and ideally changed directory to where we extracted our PCAP. Now we can use TCPREPLAY to replay a packet capture file. I used the following:
sudo tcpreplay --intf1=ens33 <pcap file>
Don't worry about the errors here. Give it a minute or 2 to run, be patient and keep an eye on the sguil console, after a couple minutes you should start seeing alerts. Like pictured below.
In the console we have alerts in the first pane. If we select "Show Rule" we can see what the snort/suricata rule is flagging on in this packet capture. Take note of what each rule looks like as you select each alert in the first pane.
Now, an alert is nice, and the context given from the rule is nice, but how would we know if this was a false positive or not? The Really great thing about tools like sguil is that we can pivot from alert to pcap! This can be done by right clicking the alert ID field and selecting either show transcript or show in WireShark. It may be best to view the alert pcap in wireshark because that will give you the ability to carve files from the pcap if needed. For example, if you wanted to carve an executable and the use "md5sum" command to get the hash to run through virustotal, you could do that as a simple first step analysis of whether this is a known file or not. Below is a screenshot of being able to select to view transcript or pivot to wireshark, then a screenshot of this sample in wireshark.
And finally, to wrap this up, I've included a couple more screenshot of different malicious pcaps I ran, just to show some of the different alerts and to reinforce the process I was using. I hope this you find this guide useful, let me know if there are any questions. Future posts will probably include some more deep dive into carving files and performing some static properties analysis and maybe some decoding or static code analysis.


One item to note about this VBS Worm family (H-Worm, VJ-Worm etc...) is the information being sent in the User-Agent about the infected host, as highlighted above.
You can learn more about H-Worm in one of my older posts here.


Comments
Post a Comment